
Why study inferential statistics?
It’s very common to read news and articles with “studies have shown that X!” or “science proves that Y” in today’s age of information. Or even read scientific papers with some dubious affirmations when dealing with reporting results and drawing conclusions from experimental data. Statistical inference is one of those topics in which the basic concepts are very important to grasp to avoid any misconceptions when interpreting it.

Statistical inference involves estimating from sample data and generalizing it to a wider population. It is widely used in different areas, like clinic trials, psychology studies, biological studies, and many more research fields. Inference techniques are also very important in the industry, making it possible for companies to obtain valuable insights with certain confidence while keeping the costs of experimentation to a minimum. Famous use cases in the industry occur with marketing, SEO (well, it’s also marketing ), UX research, etc.
But why am I mentioning this? It’s because I recently finished a course called Improving your statistical inferences by Daniel Lakens from Eindhoven University of Technology. The course is very useful to remember some basic concepts you may have forgotten from your undergraduate statistics course (like myself :D), or want to have a better understanding of how do we learn and draw conclusions from experimentation. I’ll briefly highlight some interesting concepts that are addressed in the course, with some thoughts on the importance of the topic.
Common Pitfalls
I like to read psychology-related studies that in some way try to measure human behavior (like the priming effect), often through experimentation. You can find some examples of scientific psychology experiments here. A solid statistical inference knowledge helps to effectively read and understand the results of such experiments, but also to improve your analytical capabilities in statistics. Some core statistical inference concepts are misunderstood or not correctly interpreted, and this course also focuses on the correct interpretation of some of them.
Here are some of them:
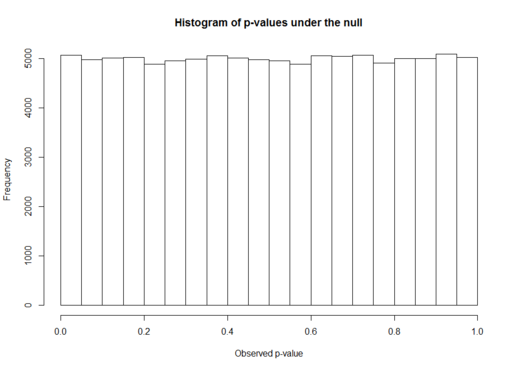
- P-values
P-values are commonly reported at the end of a statistical test/analysis, but sometimes they are misinterpreted. They do not state anything about the theory, just about the data that was collected. You cannot know what is the probability that the null hypothesis is true by analyzing just the P-value, or even if the effect observed has any practical importance by looking just at the p-value. The course talks about the main misconceptions about p-values and how to correctly interpret them, also mentioning when bayesian statistics can help you answer questions the p-value cannot.
- Likelihood
I first studied the concept of likelihood in my undergraduate statistics course, basically to use a commonly used method called Maximum Likelihood Estimation. Later when studying logistic regression I saw it again, as traditional logistic regression is a maximum likelihood estimation of the odds of the classification variable. It is unusual for me to encounter studies that directly use likelihood methods, nonetheless, it’s a very important concept that is commonly misunderstood. Also, likelihoods and likelihood ratios are good methods to study alongside Bayesian inference concepts (e.g. Bayes factor).
- Type I and Type II errors in hypothesis testing
This is a topic that very often is looked down on, but it has a high impact on the scientific results and also on meta-analytical studies. There are experimental settings and designs which can inflate the error rates of some studies if not properly controlled, which can lead to some dubious results. In Darrell Huff’s famous book How to Lie with Statistics there are a lot of examples of type I error manipulation. A company trying to market a new product could perform 100 studies but report only the studies where their product had a better outcome (even though it could be purely by chance). That’s why it’s important to know what Type I and Type II errors are, how they occur and how to control them.
- Effect sizes
Effect sizes are one of the main metrics some researchers are concerned about when performing studies. It measures the magnitude of the observed effect in the experiment, in a way we can compare it against others (using a standardized metric of course). When looking at an ANOVA study, how do you know the magnitude each factor explains about the independent variable? Or even simpler, how do you know if your statistically significant finding has any practical importance? Effect sizes can help to answer these questions. The course mainly focuses on Cohen’s d and Pearson correlation (r), but it addresses the topic in a very insightful manner, with a lot of hands-on simulation.
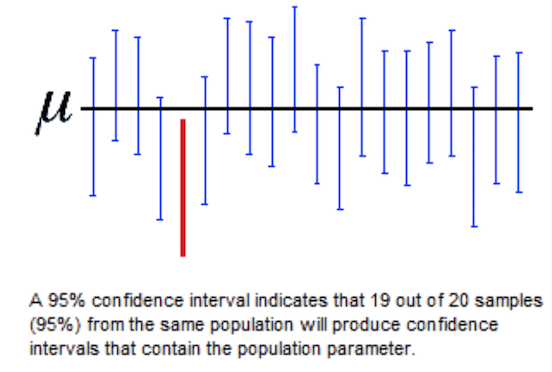
- Confidence Intervals
Aaahh, the notorious confidence interval! It is one of the most misunderstood concepts in statistics, but widely reported and used everywhere, from political polls to newspaper reports. Lakens focus a lot on the many pitfalls of confidence interval interpretation, talking about other intervals they are semantically mistaken for, like capture percentages/prediction intervals.
Overall impressions
The course is very simple and deals with very little mathematics, so it is easy to grasp the concepts for anyone who knows the basics of statistics. After all, the course is done by a researcher in psychology, and a lot of examples in the classes are from psychological research. The course demands little to no programming experience, as the scripts (in R) are all ready to run, you just need to change the parameters and experiment with it.
It also tackles some other topics than the ones I mentioned in the last section, including an overview of open science and the problem of publication bias, which I found very interesting to learn about. For more information, you can check the complete syllabus in the Coursera page.
It was a fast and enjoyable refresh on the basics of statistical inference topics, so I highly recommend for anyone interested in research and statistics, or also if you work in an analytical role like data science, business analysis, quantitative research, etc.