
Last year I found out about a Gacha game called Saint Seiya Awakening, which I’ve tried to play for some time, but then gave up on it. However I still do watch people play it, people who usually have enough time to invest in the game (it demands quite an amount of your time to be at a competitive level). Gacha games are usually free-to-play, but it is full of loot boxes, roulettes, slot machines, microtransactions and everything else that makes the player want to buy stuff in-game. They’re a treasure for statistical studies and simulations, but as in classical gambling most of the time you’ll just confirm that the house always wins.

Mechanics
This time I decided to simulate a particular event of this game, called Fortune Cat Event. How it works: I this game, there’s a currency called Gem(s), which is an important item to obtain good characters in the game. The fortune cat event is basically spinning a roulette up to eight times. For each spin, you need to have a different amount of gems in your account (this requirement always increases), and the outcome of each spin is always positive, i.e. you can’t lose gems, always get more.
This is the base outcome table:
| Required Gems in account | Minimum Outcome | Maximum Outcome |
|---|---|---|
| #20 | 1 | 8 |
| #30 | 1 | 18 |
| #65 | 1 | 23 |
| #150 | 1 | 38 |
| #240 | 1 | 48 |
| #330 | 1 | 58 |
| #500 | 1 | 88 |
| #660 | 1 | 228 |
E.g.:
Suppose you have 300 gems in your account. Then you’re guaranteed to play the roulette at least 5 times (with the respective requirements of
20, 30, 65, 150and250gems). If the sum of all spins + your current gems (300) is at least 330 then you could continue spinning. Suppose your outcomes were, respectively:(3, 10, 5, 20, 20). This means that when you get to the spin with requirement330you’ll have300 + 3 + 10 + 5 + 20 + 20 = 358, meaning you could spin it one more time.
In a public Brazilian forum about the game, someone posted a table to summarize the outcomes you can expect in this roulette. The table below contains the same information as I presented above, plus the expected average of each roulette spin:

Column
"CUSTO"is the required gems you need. Column"MAX"is the required gems + maximum outcome. The mean outcome, assuming a uniform distribution, is shown in column"MEDIA". Please note that the mean has been rounded down, but this won’t matter very much in our simulation."TOTAL"indicates the sum of the means of all roulette spins,255considering the approximations made. The table was made by the player ‘Yachiro’, on server 31 of the global game.
Monte Carlo Simulation
Considering the table above, on average the total outcome – given that you have at least 660 gems – would be close to 255. But what if the distributions for each roulette spin is not uniform? 🤔🤔Some players have reported on Reddit and in other forums that indeed the distribution is skewed towards lower outcomes, but I haven’t found any true reliable data to make any statistical inferences.
From a profitability point, one can see how a skewed distribution would favor the house. Gems are rare items that make the player be more competitive in the game. The gems can be bought with real currency, and there’s also a nudging effect for someone to buy just enough gems to participate in this roulette. That is if you have 200 gems you can only spin 4 times, but you could buy 40 more gems to spin it another time in the #240 requirement spin and win more gems that you actually paid.
The idea of this simulation is to estimate the probability that you get more than 255 gems when you spin all the roulettes. For this, I’ll assume the player always has more than 660 gems so he can spin 8 times in fortune cat. Formally, what we’re trying to estimate is
$$ P(\text{sum of outcomes} > 255) $$
In the baseline case (assuming each spin follows a uniform distribution) and calling $X_1, X_2, X_3, X_4, X_5, X_6, X_7, X_8$ the random variables for spin requirements #20, #30, #65, #150, #240, #330, #500 and #660 we basically need to calculate the Cumulative Distribution Function for the sum of each distribution, $S = X_1 + X_2 + X_3 + X_4 + X_5 + X_6 + X_7 + X_8$. From undergraduate statistics you know that the sum of two standard uniform variables is a Triangular Distribution, with known formulas for the PDF and CDF. However, this doesn’t hold if the summation is over multiple uniforms with different parameters or for different distributions. To estimate these values I’ll use a rather useful technique called Monte Carlo method.
Problem Definition
The idea of the simulation is to create a probability distribution hypothesis for all the spins, simulate the spins and sum their outcome, giving us a sampling of $S$. The hypotheses are the “unfairness scenarios”, i.e. I’ll start with a uniform distribution and slowly skew the distribution towards lower reward values. Since the outcomes are discrete (you cannot get half a gem for instance), I’ll assume that each individual random variable is $X_i \sim BB(a_i, 1, n_i)$ where $BB$ stands for a Beta-binomal distribution. Changing $a_i$ I can slowly skew the distribution towards lower rewards, with $a=1$ and $b=1$ being a uniform distribution. The next image shows a graph with the different hypothesis, for a single $X_i$:
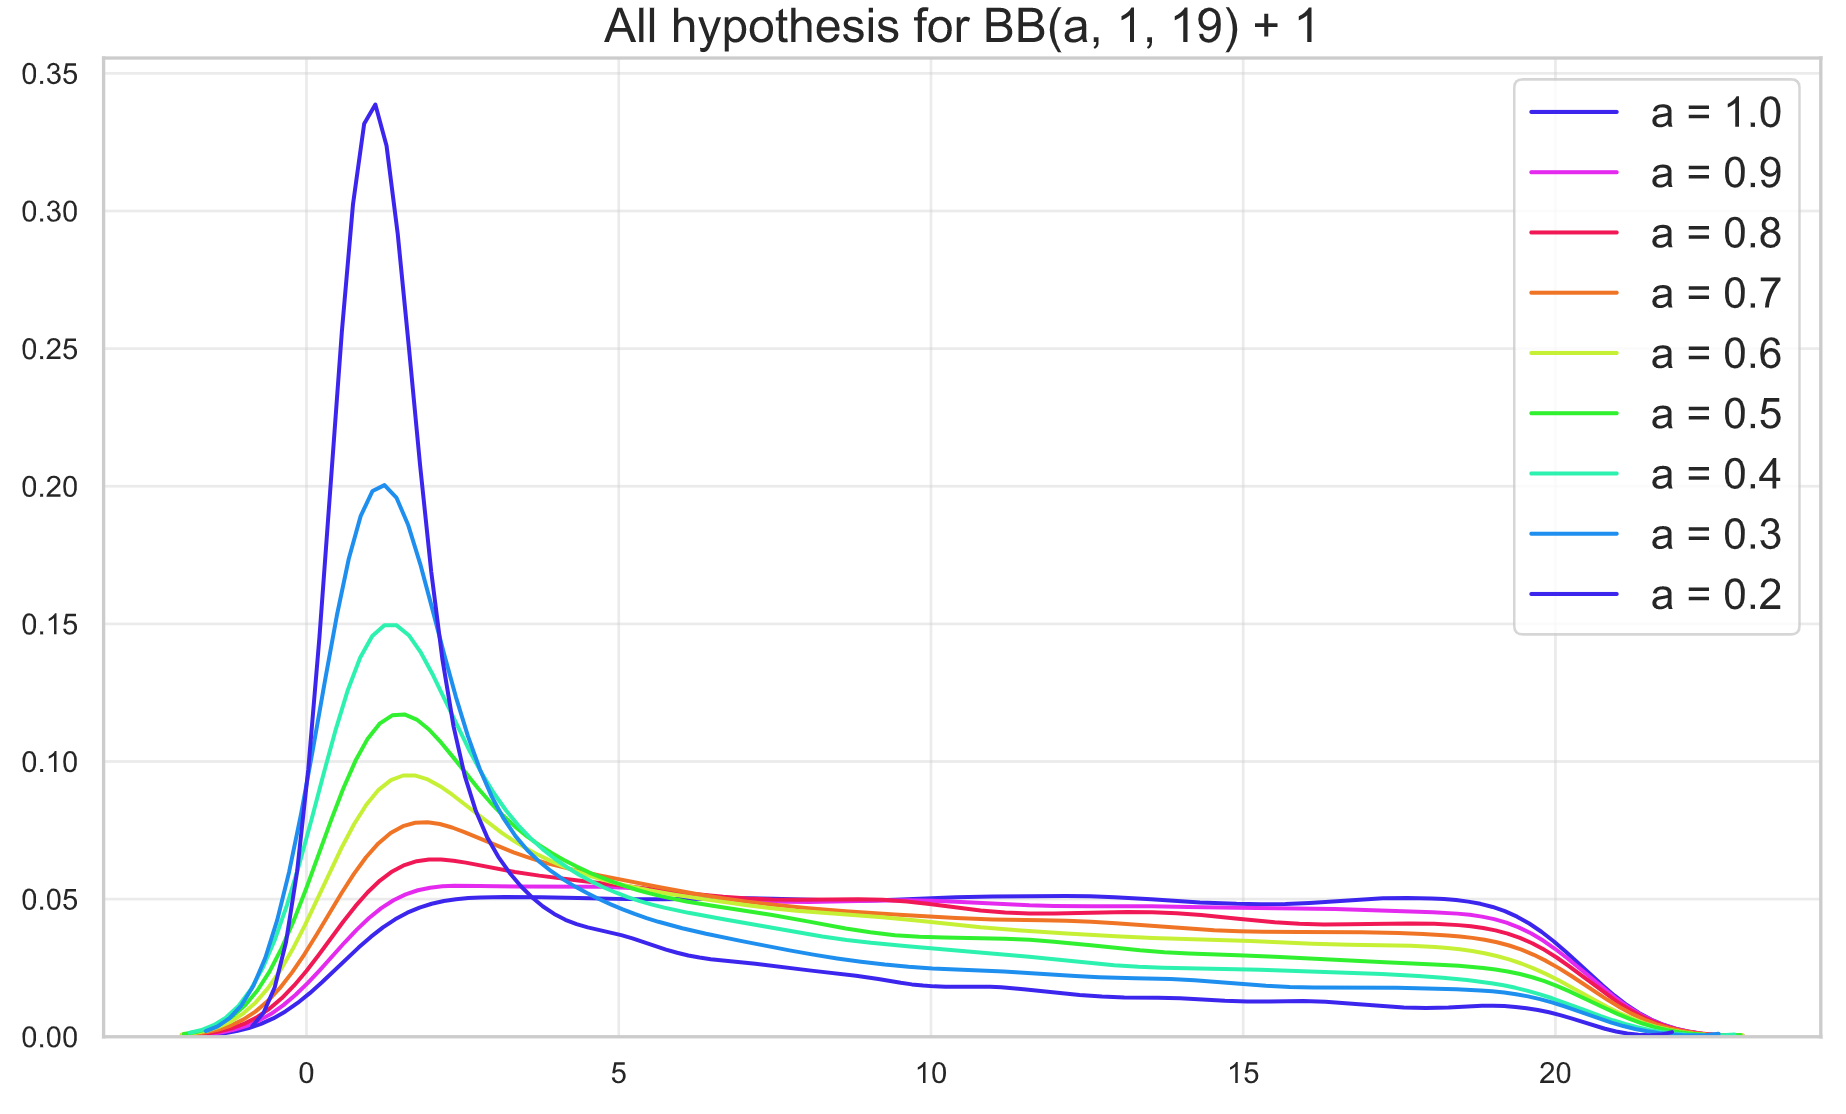
In the code I use $BB(a_i, 1, n_i - 1) + 1$ to adjust the domain of the random variables since we cannot get a
0outcome.
Results + Code
The simulation samples a point from each $X_i$ and sums them, giving us a sample of $S$. This procedure is done $10000$ times for each hypothesis. It’s important to note the hypothesis $h$ changes for all the spins, i.e. in the first run all spins are uniform, in the next all spins are slightly skewed, etc. After all the simulation is done, we can use a KDE to plot the estimated PDF of each $S_h$, depending on the $a$ parameter of the Beta-binomial chosen for each run.
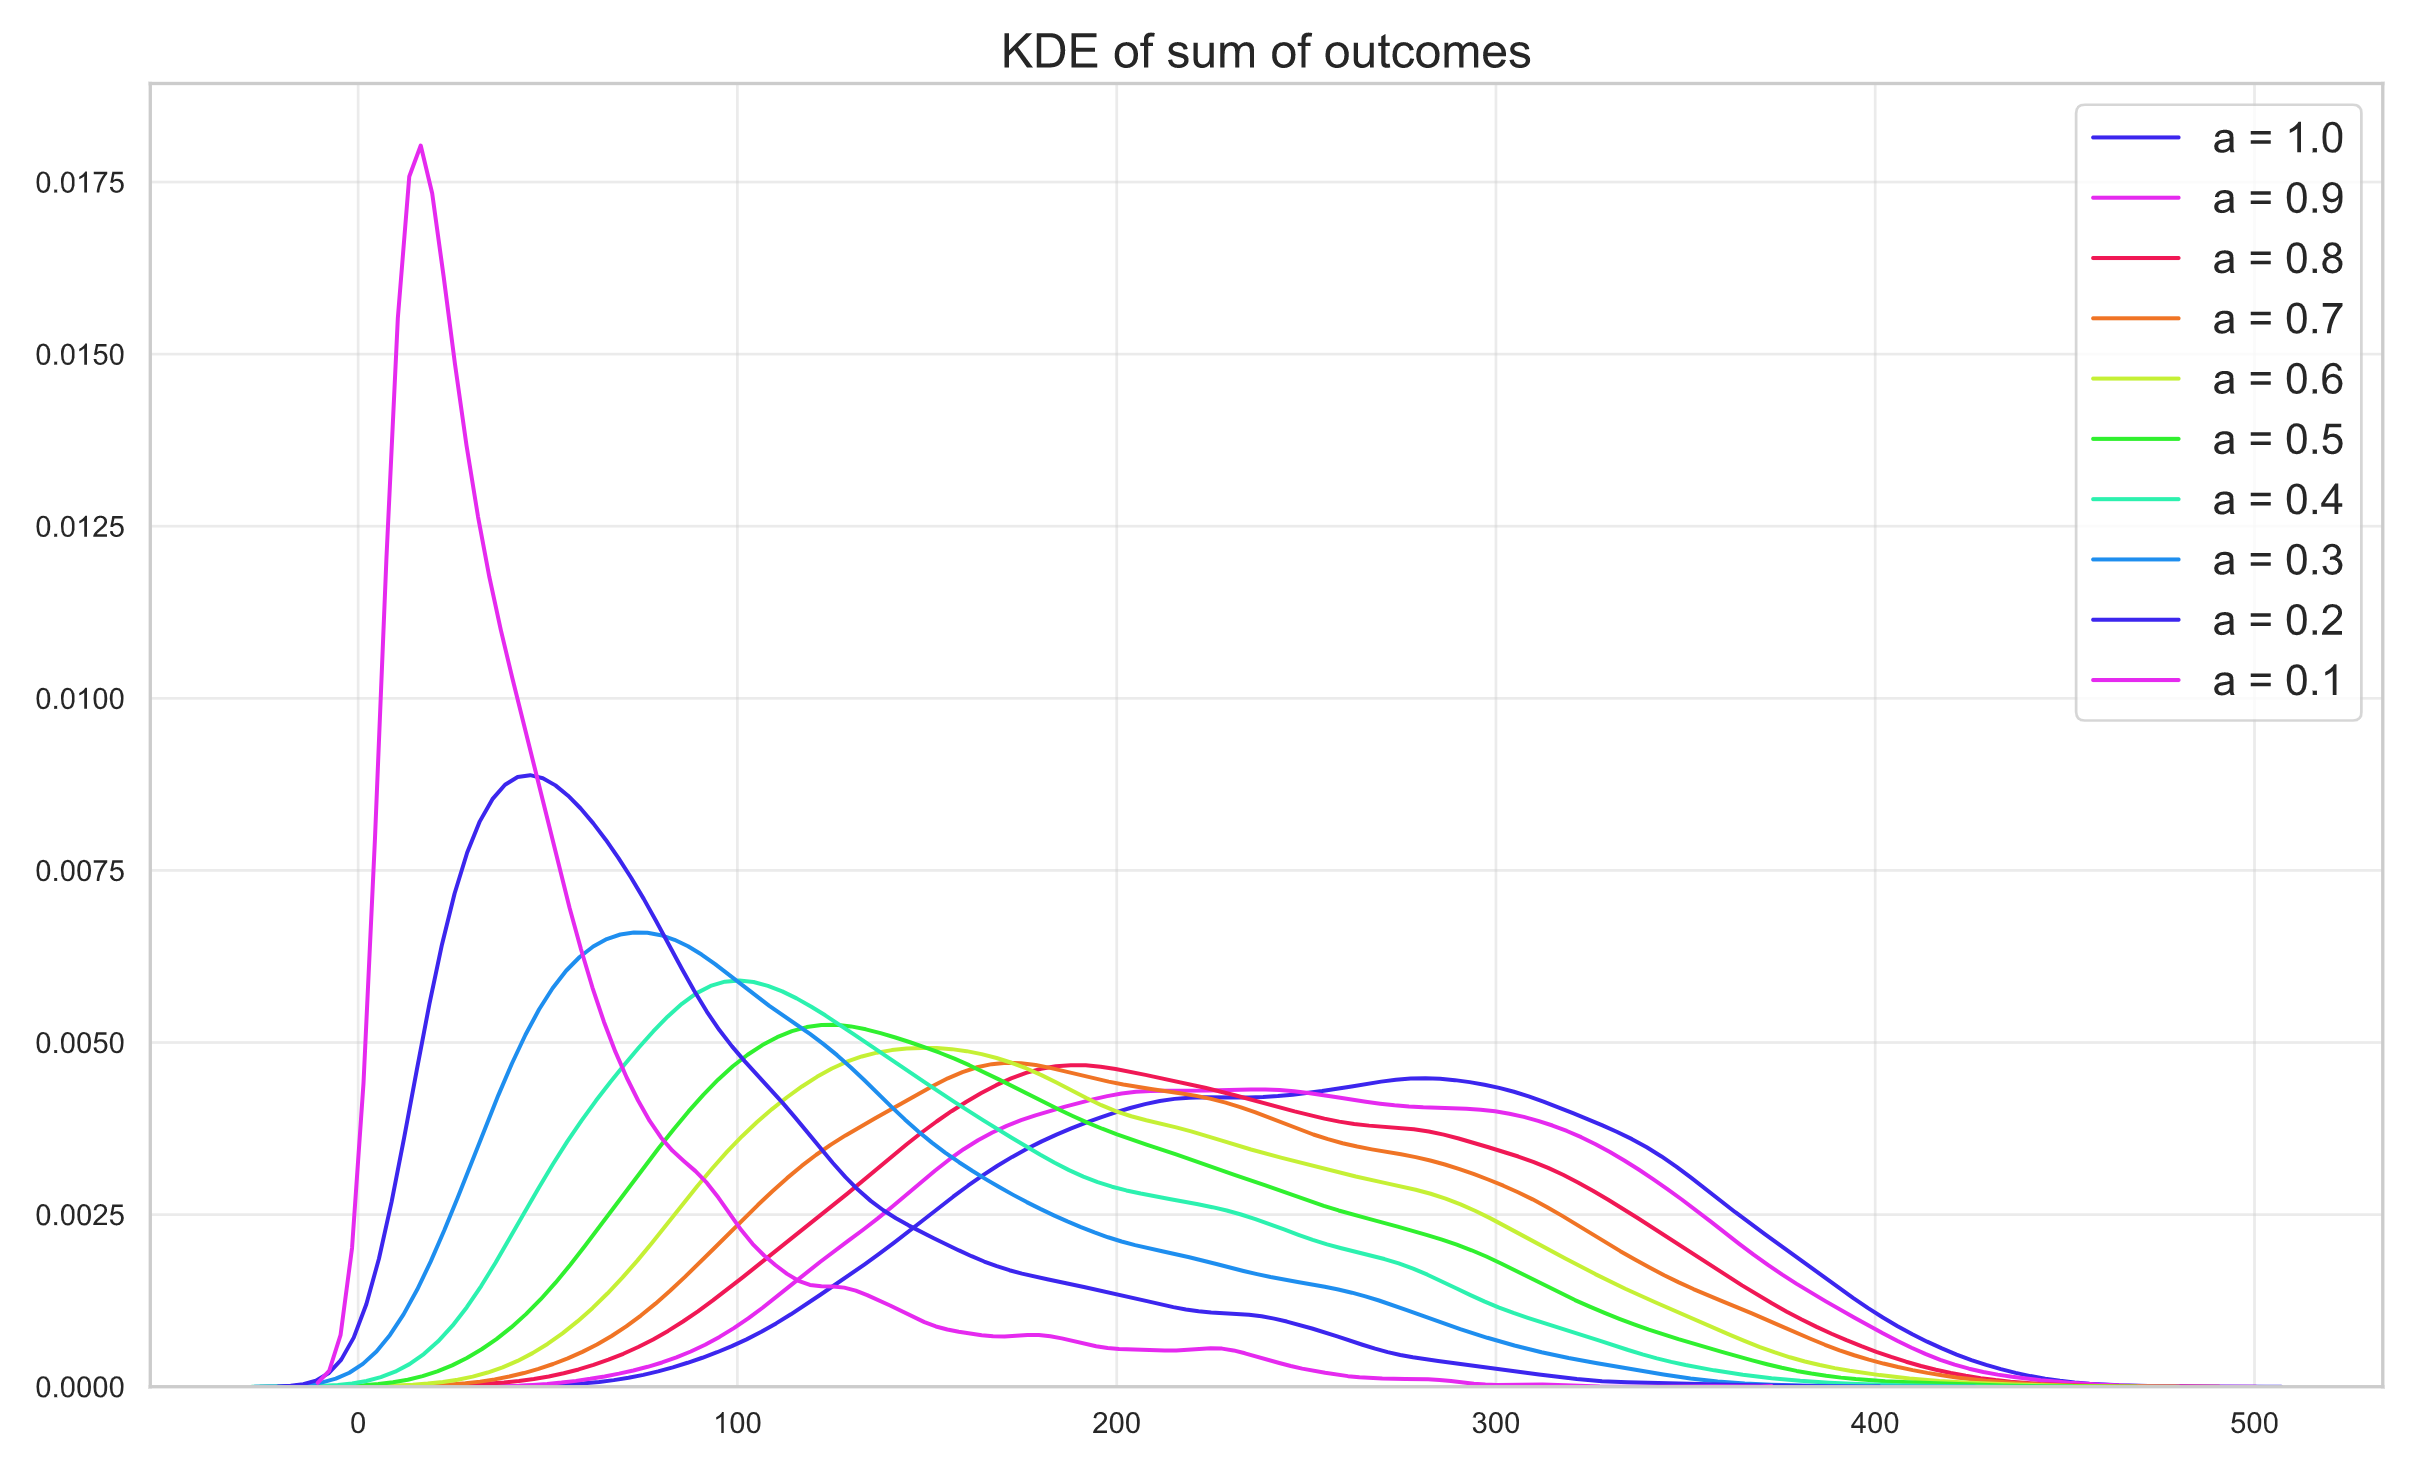
The estimated PDFs of the sum of these independent Beta-binomial distributions give us a sense of what one could expect of the cumulative distribution. Computing the ECDF we can finally calculate $1 - ECDF_h(255)$ for each hypothesis $h$ to obtain the desired estimated measurement of $P(S_h > 255)$, shown below:
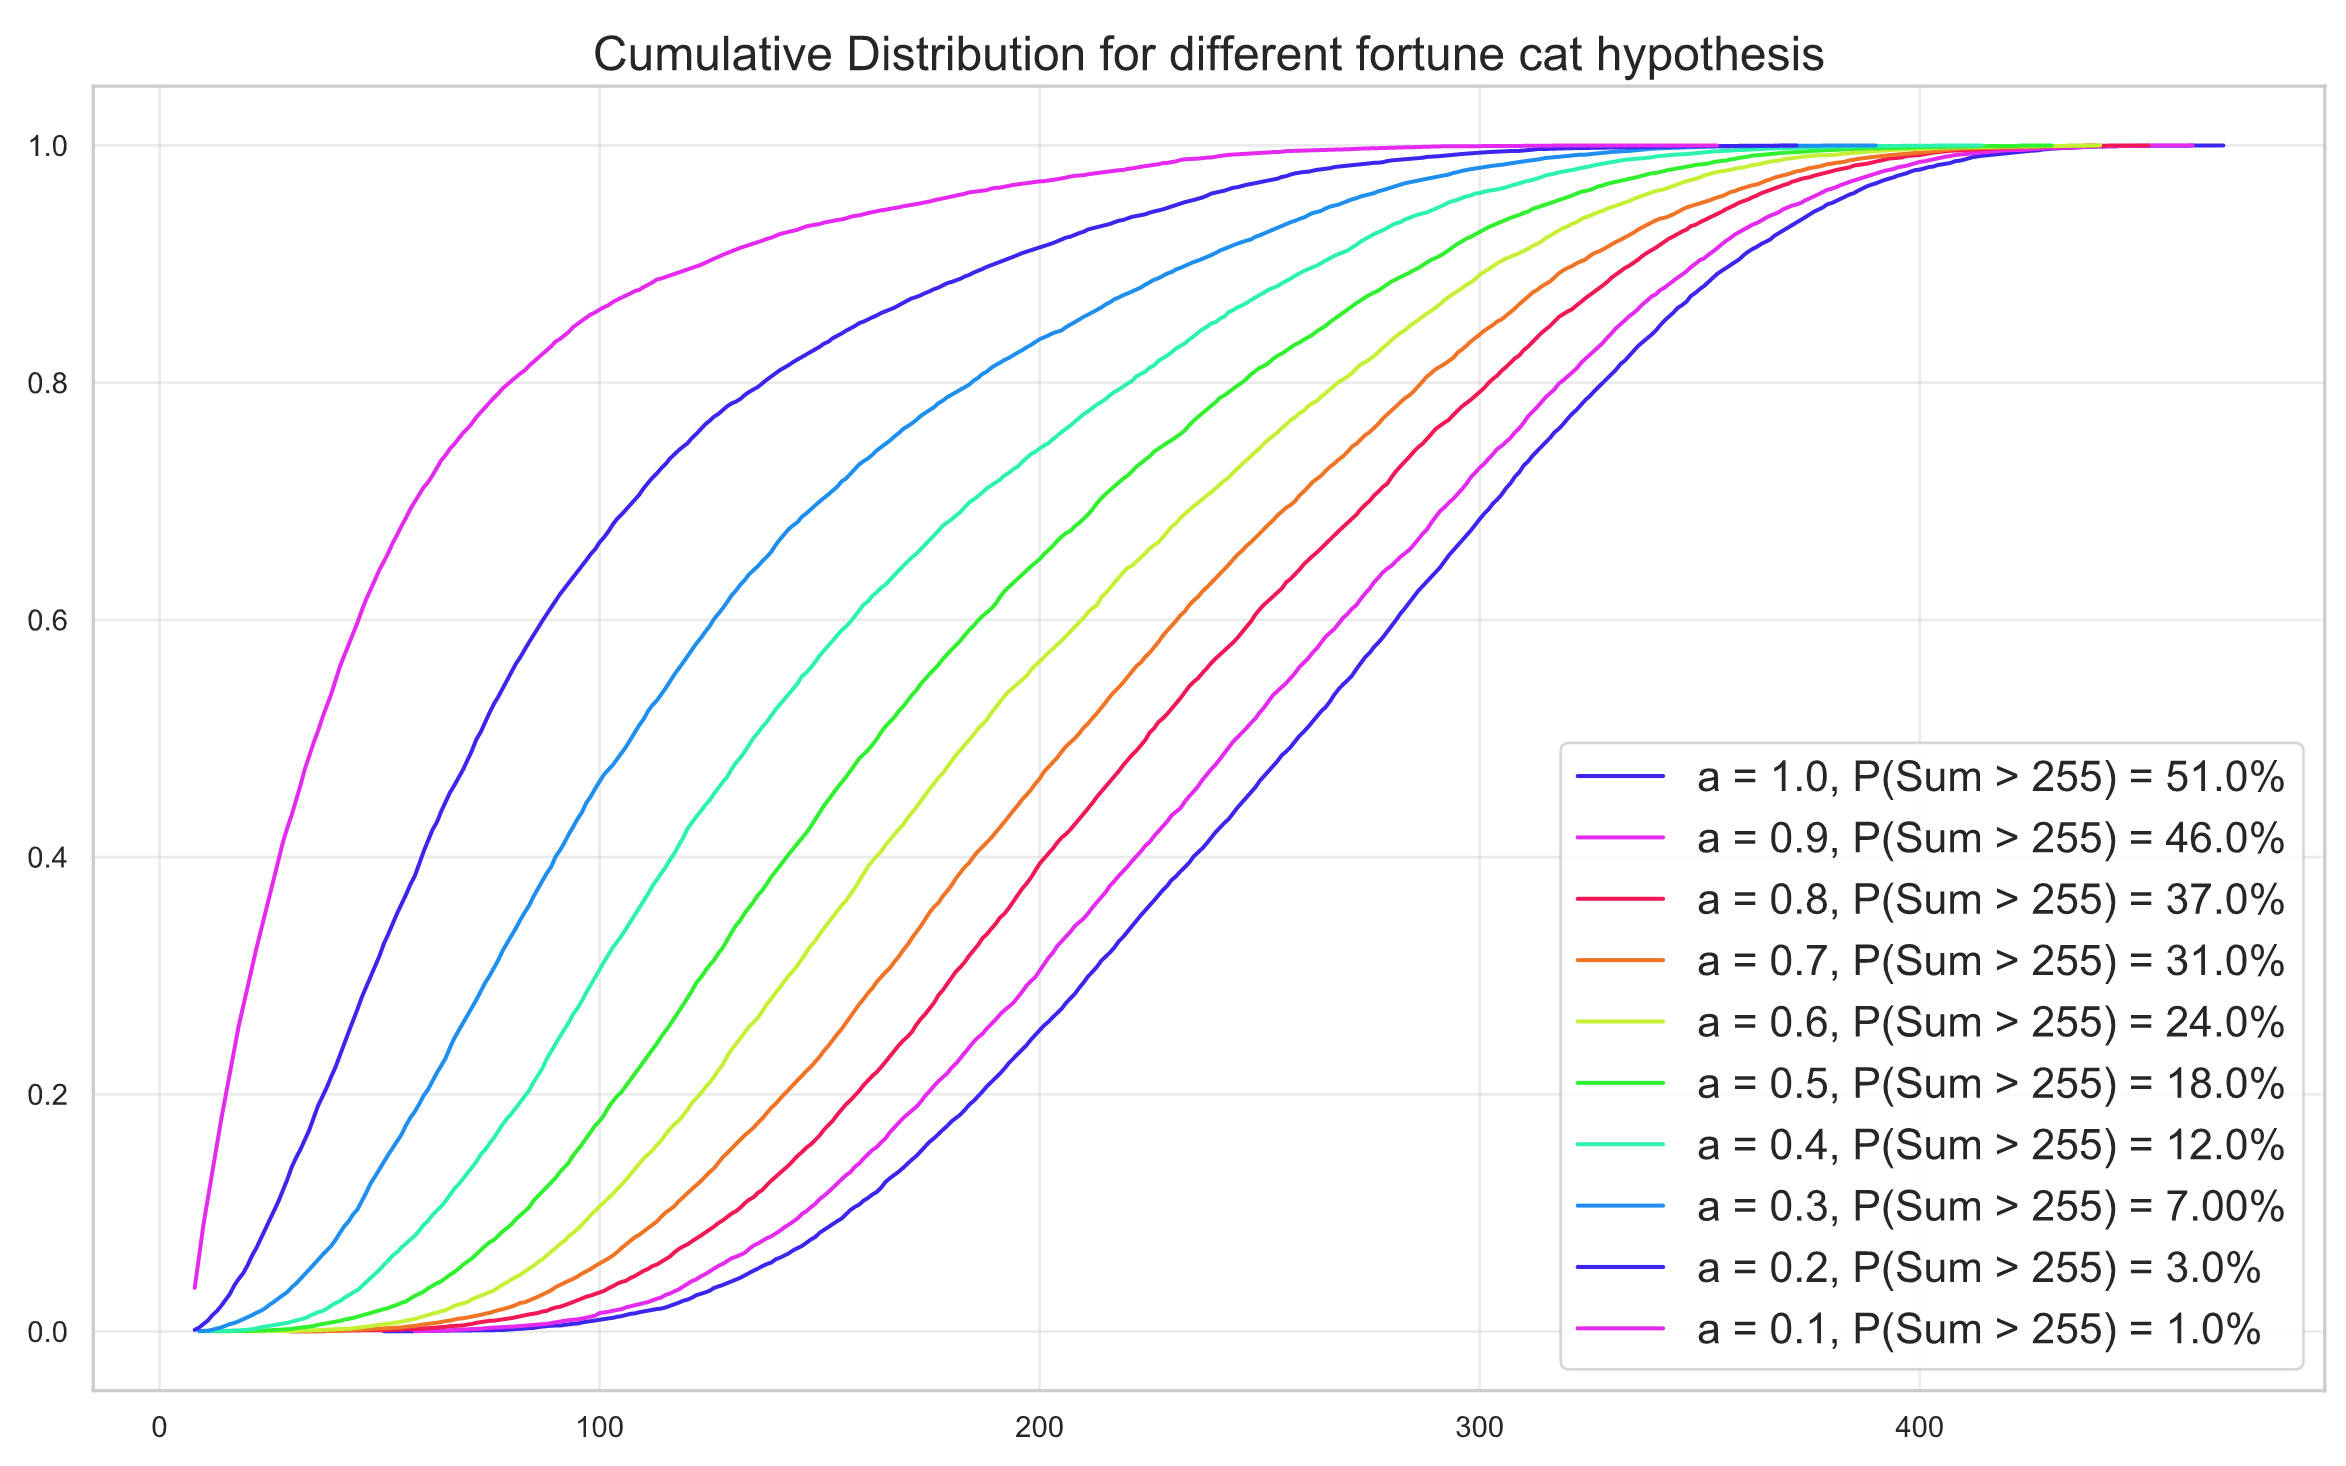
Now, here are some takeaways from this result:
- With the uniform hypothesis, it’s true that on average half of the times you spin all 8 roulettes you get more than 255 gems;
- A small individual skewness in the distribution, e.g. $a = 0.6$ can lead to a rather big variation in your chance of getting more than 255 gems. In this specific case the chance lowered to just $24\%$;
- From a behavioral perspective of in-game mechanics, this shrouding of the skewed individual distribution is much more difficult to detect/comply (i.e. from a common-sense perspective) than a simple unfair event, in my opinion. That is, I think if the event had just one roulette, and the distribution of this roulette was skewed, it would be easier for someone to detect. But by adding more layers of complexity (i.e. adding more roulettes, each with a different range of possible outcomes) it is way harder to have an intuition if each roulette spin is fair given the outcome (in this case the sum of multiple distributions).
Another interesting point of view is how to analyze these results as a data scientist. If this was my game and the assumptions I made about possible distributions hold, I could probably do the following procedures to optimize the profit I get from this event:
- Design an A/B testing (or maybe Multi-armed bandit), where each test group would receive the event with a different hypothesis $h$. The control would be the uniform distribution hypothesis group, and I’d probably get some measure of
churn,engagementandprofitability; - Build a model/policy to deliver the hypothesis with the best trade-off considering my measures;
- Further segment my tests, trying to find categories of players where I could skew even more the distribution without increasing churn too much (or lowering engagement). This can be considered unethical, but it is a possible scenario players should be aware of (basically, selective scamming).
Anyways, this result doesn’t mean that the game is rigged in any way, nor do I have a theory about it. It’s just a statistical simulation of hypothetical scenarios made for fun and to understand more the behavior of skewed distributions in gacha games =). You can find the code in my Github Repo or check the notebook directly here.