
I was doing some assignment about the Percolation Problem, where given a graph, find if the top of the graph is connected to the bottom. There was some test files included, but I wanted to create my own images.
The input file of my assignment has, in the first line, the dimensions of the image. The images are always in a square ratio, n x n “pixels”. The remaining lines of the file contains pairs (a b) of the coordinates in the grid n x n. This means that the position [a][b] is a pixel of our image. To generate them, I used Python, if course ;)
The main idea is to get the darker areas of the image to be the painted parts of the grid. So, for some images, it’s very useful to change the contrast. Fortunately, the PIL library has a module to make image enhancements!
First, we need the Image module from the PIL library, and Numpy to manipulate the image matrix. Importing the sys module is also required to read arguments from the terminal.
import sys
import numpy as np
from PIL import Image as im
from PIL import ImageEnhance as imEnh
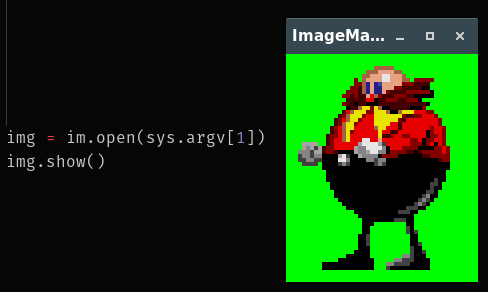
The Image module if the PIL library can read images very easily with the open() function. Also, we can show the image using the show() method in the image itself, once we opened it!
img = im.open(sys.argv[1])
img.show() # Show the image
I limited the size of my output dimension to a max of 100 x 100, to make the images be drawn faster. The images to be processed couldn’t have different width and height as well, so we check using the size variable of the image, in which the first element (size[0]) is the width, and the second (size[1]) is the height. To scale down an image, we use the thumbnail() method, passing the desired size tuple, and a resampling filter. In my case, I used the ANTIALIAS, from the Image module.
img = im.open(sys.argv[1])

sz = (100,100) # The size tuple
# If image is too large, we resize it
if(img.size[0] > 120 or img.size[1] > 120 or img.size[0] != img.size[1]):
	img.thumbnail(sz, im.ANTIALIAS)
    sz = (img.size[0] , img.size[1]) # Update the size if needed
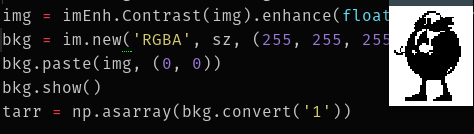
Now, we need to set the contrast of the image to what was asked in the arguments. In the PIL enhancement module, the value of the contrast go from 0 (the minimum), 1 (no changes), 2 (higher contrast) , etc. Assuming that the contrast value is the second argument, we need first to create an object of the Contrast class of the ImageEnhance module, then apply the enhancement using the enhance() method. Also, since we’ll now calculate the darker areas of the image, we have to convert the image to black and white mode, using the convert() method, passing ‘1’ as the argument.
img = imEnh.Contrast(img).enhance(float(sys.argv[2])).convert('1')
Remember that green background in the image up above? That happens because I used a PNG format image, with no background (transparent). To correctly calculate the pixels of the image, we can’t have a transparent background. To fix this, we create a white background with the image size. Next, we have to merge the original image with the bacground. This can be done using the paste() method, and specifying the coordinates where to paste (in our case, it’s always (0, 0)). Finally, we convert the final image to black and white, and convert the entire image to matrix, using np.asarray().
bkg = im.new('RGBA', sz, (255, 255, 255, 0)) # White image
bkg.paste(img, (0, 0)) # Paste the 'img' into bkg
bkg.show()
tarr = np.asarray(bkg.convert('1'))
Finally, now that we have the array, we just iterate through it, and if the value is “True” (which means its black), we store it in the output list. But first, we need to add the dimension of the image to our output. And then we just need to print the elements of the list, or write it to a file, etc.
points = list(f"{tarr.shape[0]}\n") # Dimension of the image
for i in range(tarr.shape[0]):
    for j in range(tarr.shape[1]):
        if tarr[i][j]: # If it's black
            points.append( f"{i} {j}\n")
# Output
for pixel in points:
    print(pixel, end="")
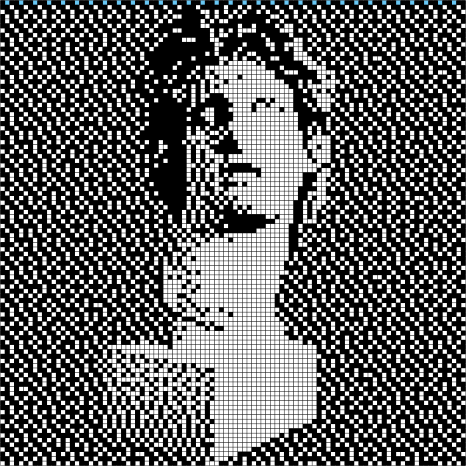
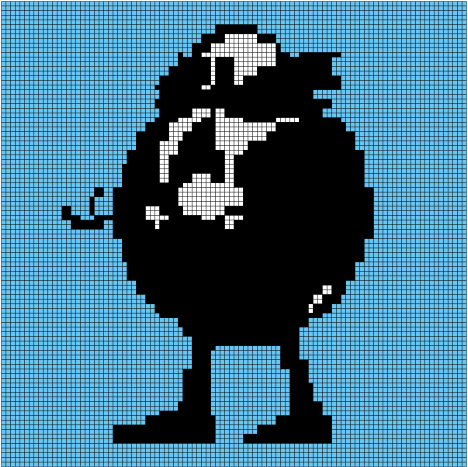
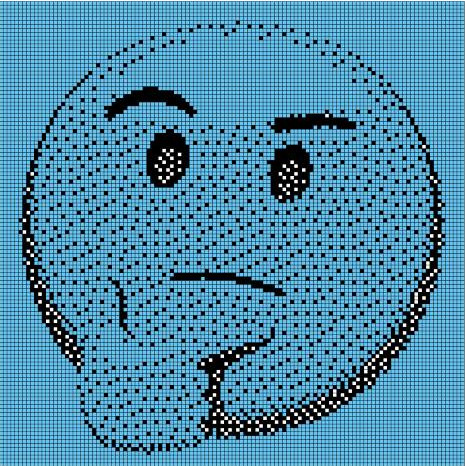
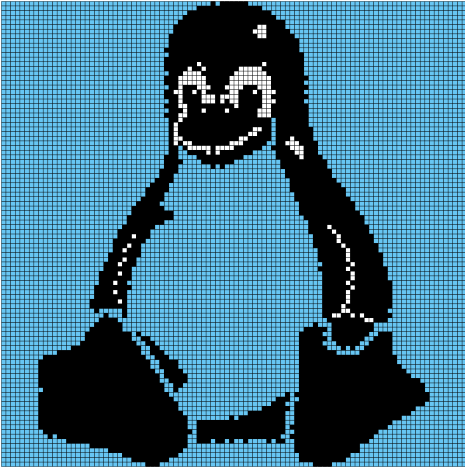
That’s it! I used the generated files in my assignment, and here are some of the grid style images:
And here’s the final code, also available in my github:
# python >= 3.6
import sys
import numpy as np
from PIL import Image as im
from PIL import ImageEnhance as imEnh
'''
Generate output with the specific x,y coordinates where the
image is black.
'''
def usage():
    print("Generate output with the specific x,y coordinates where the "
      "image is black. \nUsage: ./genTxt.py <img> <contrast> > draw.txt"
       "\ne.g.: ./genTxt.py topper.png 2.5 > in.txt"
       "img - png or jpg \n contrast (float) -  0 (minimum)...1(no changes)...2...3, etc")
    exit()

sz = (100,100)

if(len(sys.argv) < 2):
    usage()

img = im.open(sys.argv[1])
if(img.size[0] > 120 or img.size[1] > 120 or img.size[0] != img.size[1]):
    img.thumbnail(sz, im.ANTIALIAS)
    sz = (img.size[0] , img.size[1])

img = imEnh.Contrast(img).enhance(float(sys.argv[2])).convert('1')
bkg = im.new('RGBA', sz, (255, 255, 255, 0))
bkg.paste(img, (0, 0))
bkg.show()

tarr = np.asarray(bkg.convert('1'))
points = list(f"{tarr.shape[0]}\n")
for i in range(tarr.shape[0]):
    for j in range(tarr.shape[1]):
        if tarr[i][j]:
            points.append( f"{i} {j}\n")

for pixel in points:
    print(pixel, end="")